 Open model
Photo © Peter Marting
Decoding the honeybee nest
Using a 4D atlas of 12 honeybee nests, we tested how well neighboring cells predict where bees raise brood and store food.
At Auburn, our team photographed both sides of each comb in 12 colonies from April to November 2021. We reconstructed the nests in three dimensions at each observation so we could follow individual cells over time. Cells and even whole combs specialized in raising brood or storing food. In undisturbed nests, pollen accumulated on the side where the nest began and nectar on the opposite side. By fall, stores shifted toward the center. We rearranged the combs in six colonies. Their cells changed use more often and more young brood died, yet worker populations and nest sizes remained comparable to those in undisturbed colonies.
 Expand figure
What can neighboring cells tell us?
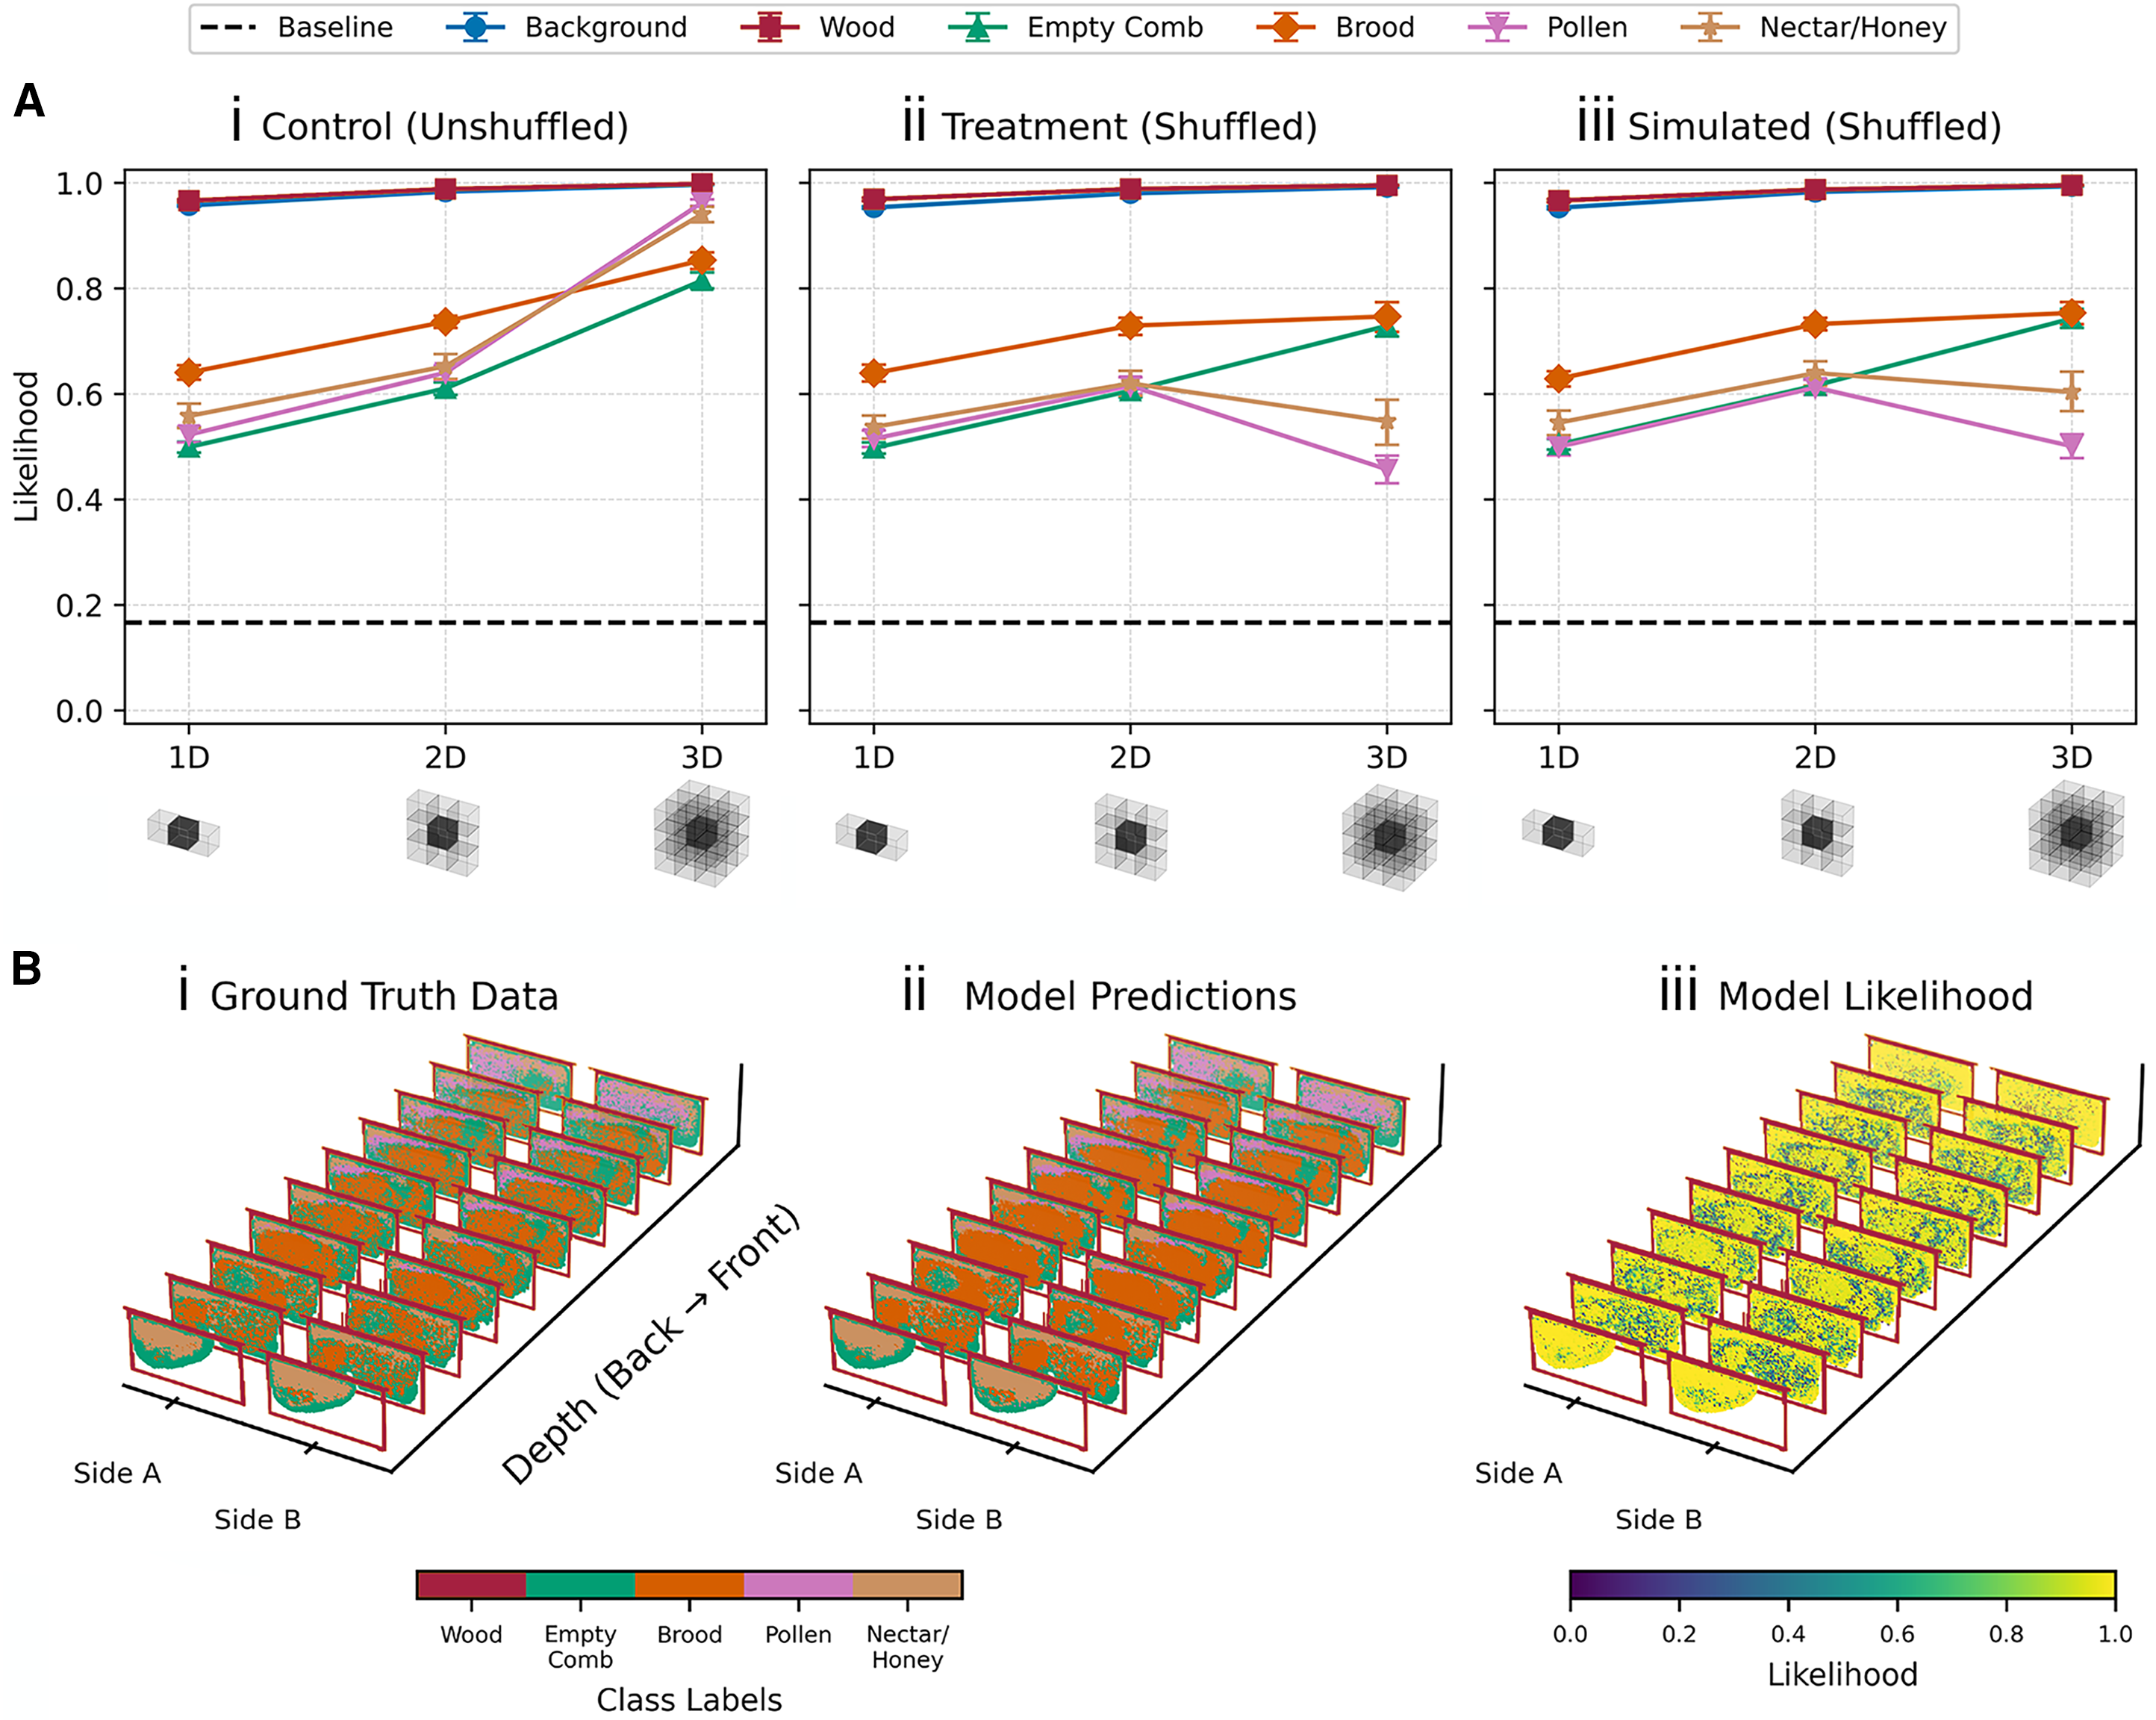
Panel A compares how much probability the model assigned, on average, to the recorded cell contents using neighbors along one, two, or three axes. Looking across combs helped it predict pollen and nectar or honey in intact nests. Physical or simulated shuffling largely erased that advantage. Panel B shows one colony’s recorded cell contents, the model’s predictions, and the probability it assigned to the observed class at each cell.
Figure 6 · Marting et al., Current Biology (2026) · CC BY 4.0.My contribution
I developed and fitted an autoregressive model that predicts a masked cell’s contents from its neighbors. I compared predictions using neighbors along one, two, or all three spatial axes. The model performed best when it could see across neighboring combs as well as within a comb. Shuffling combs physically or in simulation largely erased that advantage, especially for pollen and nectar or honey. I visualized these results in Figures 6 and S11, reproduced analyses from Peter Marting’s notebooks, and built the interactive explainer.
Hives Alive
Artist and biologist Peter Marting turned nest maps from Michael Smith’s lab into Hives Alive, an outdoor installation that opened in September 2026 at Auburn’s Donald E. Davis Arboretum. Up to 2,000 illuminated globes hung from the trees. Each globe represented a cell, and its color showed where the bees were raising young, storing pollen or honey, or leaving cells empty. Photographs and interviews from Auburn University.
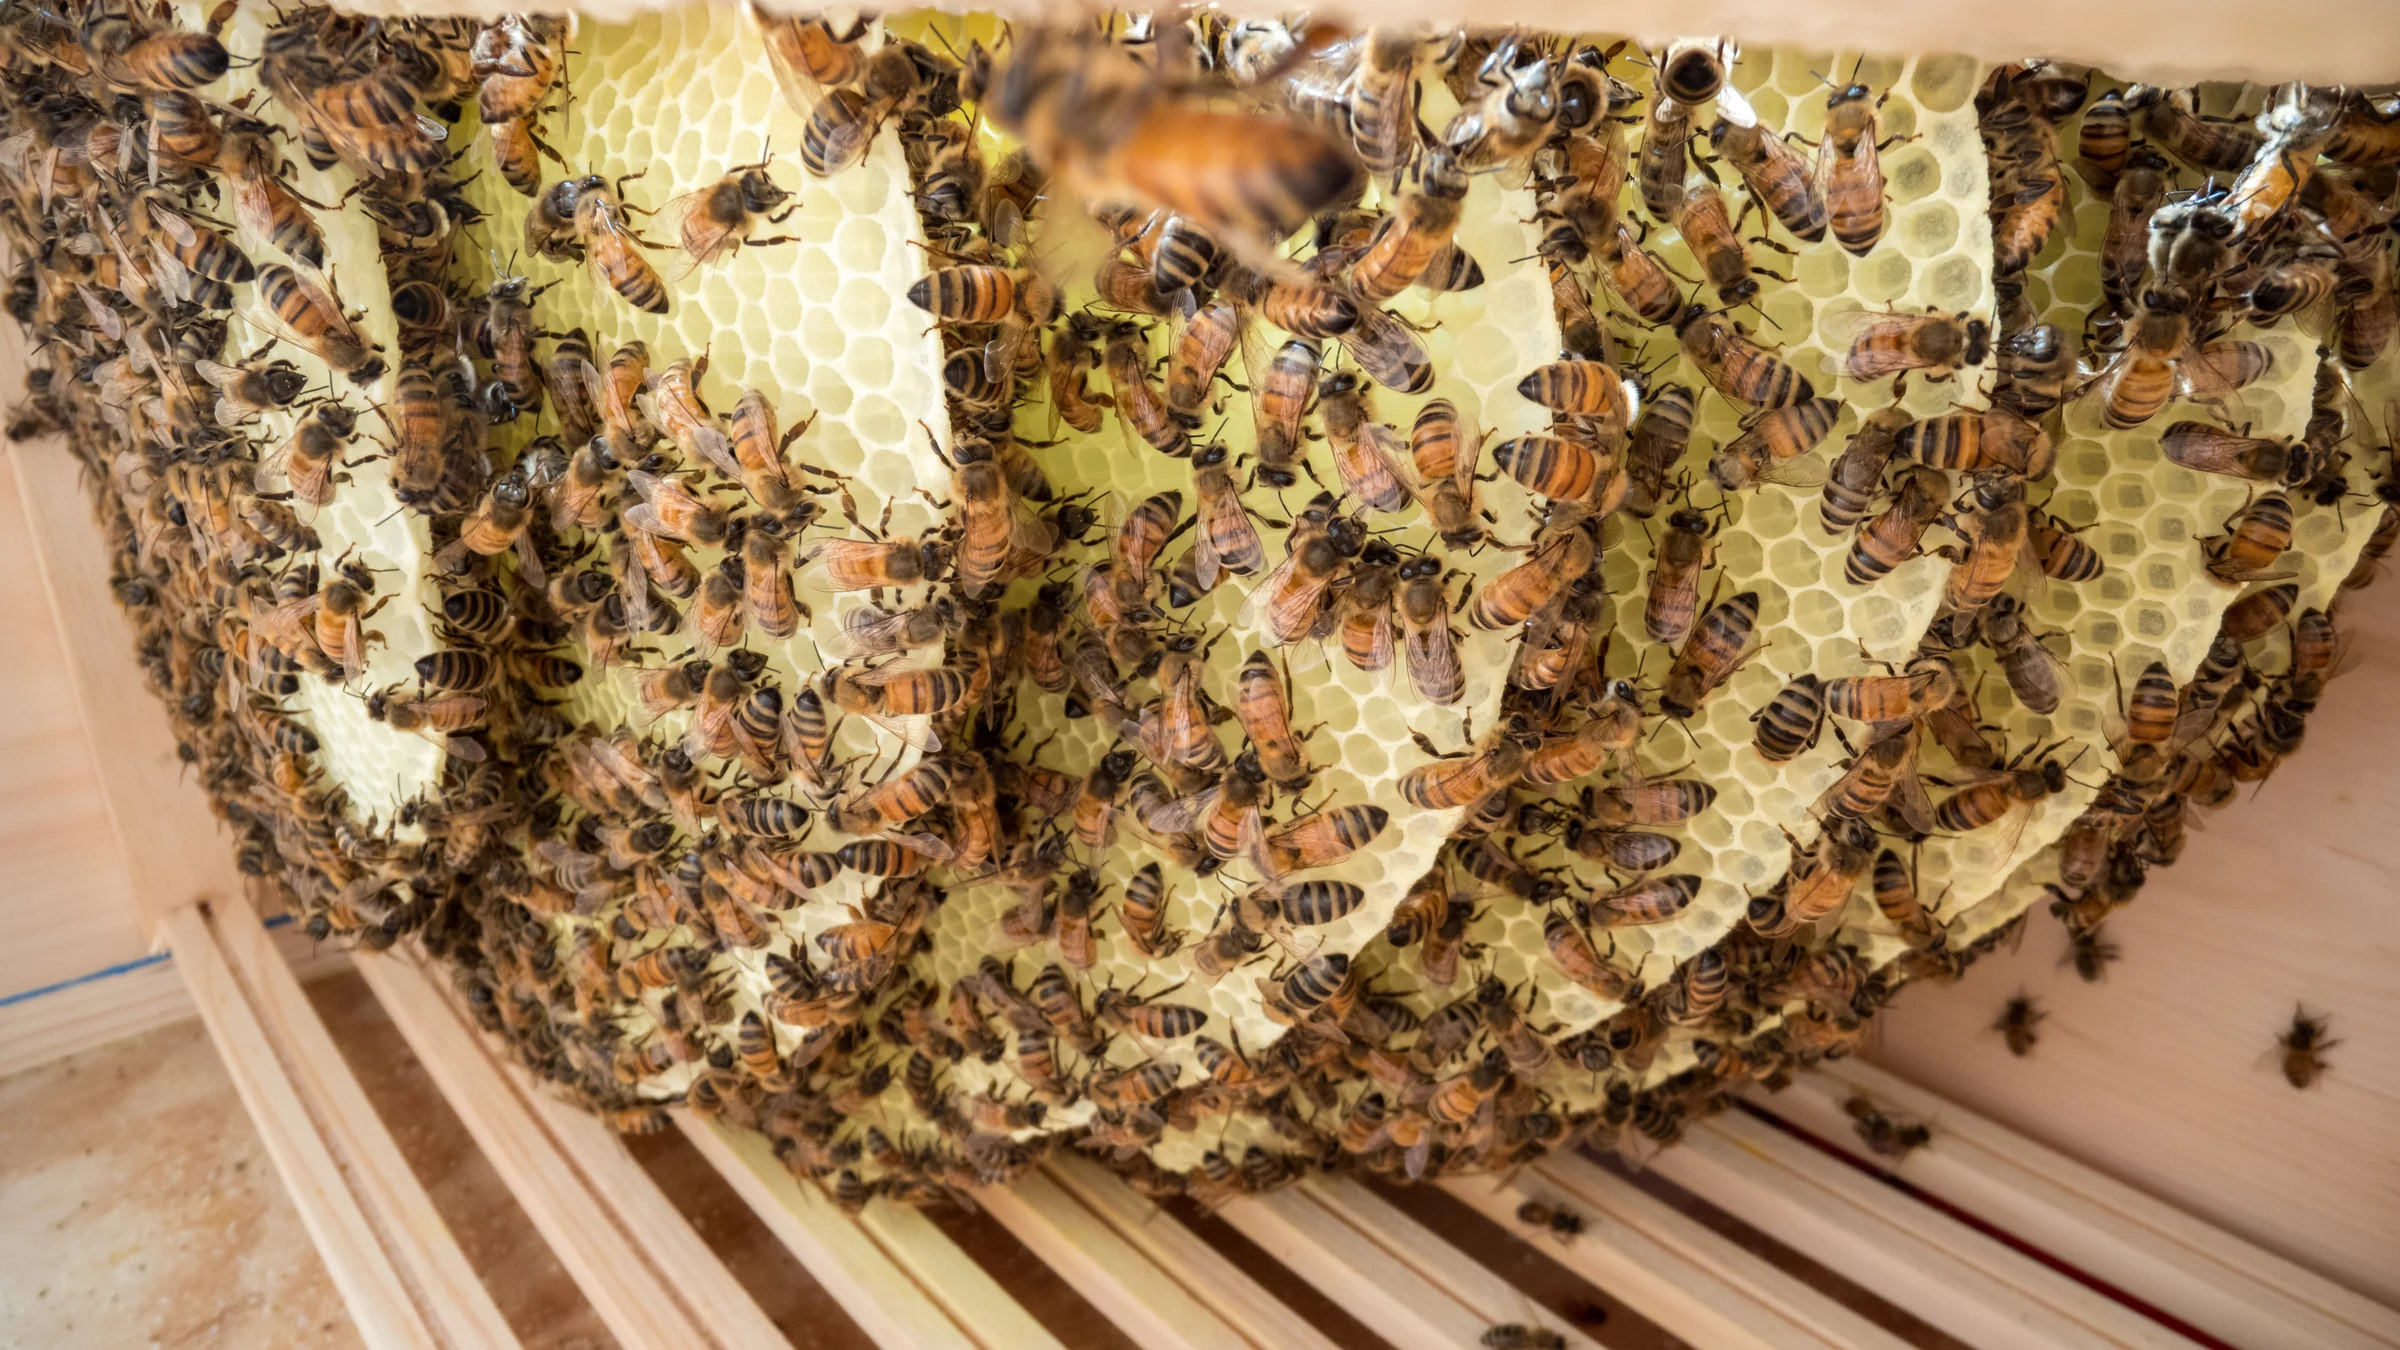
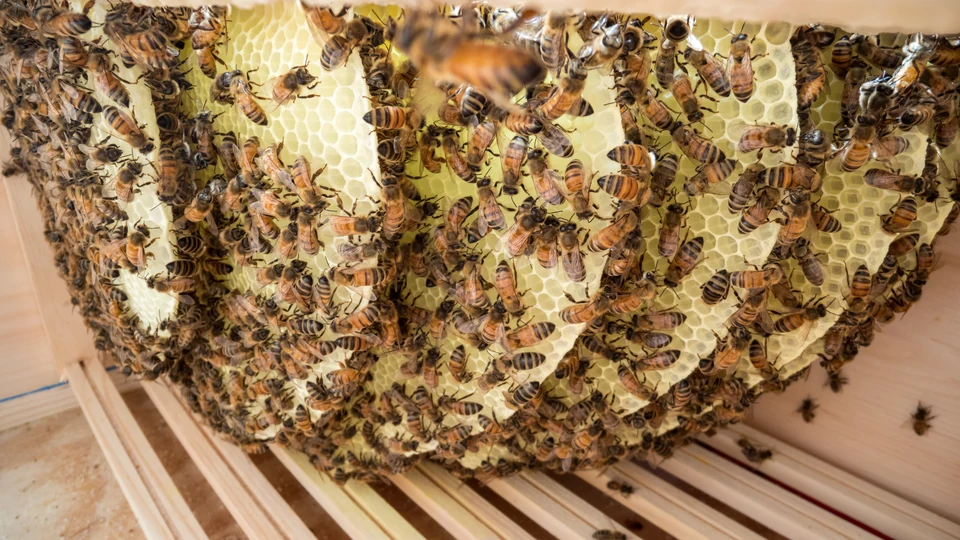
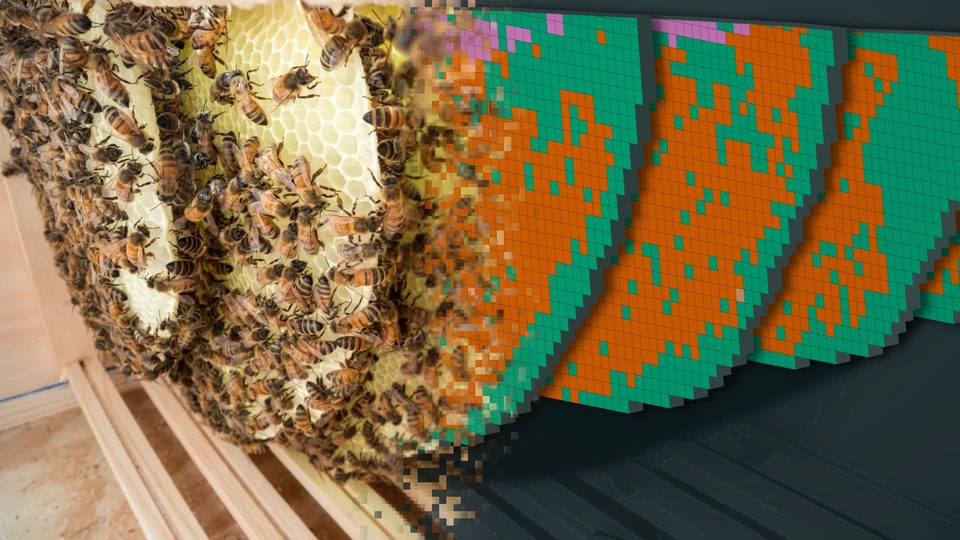
In the opening image, the nest photograph dissolves into a 3D view of colony DD1 at its first observation. The colored squares on the parallel comb faces show cell contents recorded in the interactive atlas. Photograph © Peter Marting, cropped as shown in Figure 1A(i) of Marting et al., Current Biology (2026), CC BY 4.0.